Thermo Fisher Scientific › Electron Microscopy › Electron Microscopes › 3D Visualization, Analysis and EM Software › Use Case Gallery
To statistically study the 3D shape of oesophageal cancer (EC) and its spatial relationships based on computed tomography angiography (CTA) 3D reconstruction, to determine its relationship with T-stages, and to create an optimal T-stage diagnosis protocol based on CTA calculation.
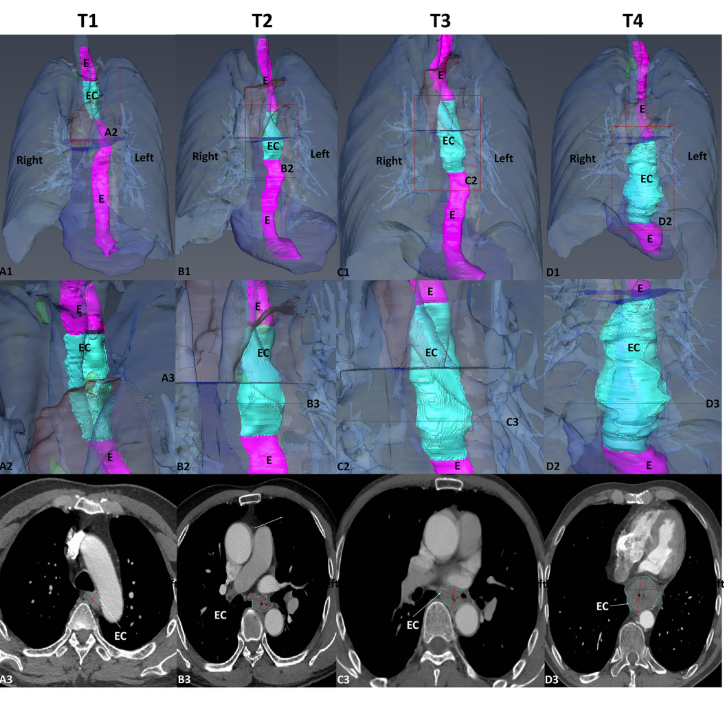
Pre-operative CTA images of 155 patients with EC were retrospectively collected and divided into four groups: T1–T4. We used Amira software to segment and 3D reconstruct the EC, oesophagus, aorta, pericardium and peripheral lymph nodes and measured their surface area, volume, major axis, minor axis, longitudinal length, roughness and relationship to the aorta of the EC. One-way ANOVA, independent sample t-test, ROC, etc., were performed and critical values between different T-stages were calculated. We also invited two radiologists to evaluate the measurements.
There were no significant differences in EC longitudinal length, roughness score and relationship with the aorta between the different T-stages of EC. There were significant differences in EC surface area, EC volume and mean major and minor axis among the different T-stages. The volumes of the T1–T4 tumours were 12,934.36 ± 7739.25, 23,095.27 ± 14,975.67, 37,577.98 ± 36,085.64 and 58,579.25 ± 41,073.96 mm3 separately (p < 0.05), and the T1–T4 volume cut-off values were 11,712.00, 19,809.00 and 44,103.50 mm3 separately. For comparison with radiologists, the AUC value of our measurements was 0.704, which was higher than the radiologists of AUC = 0.630.
EC volume, major and minor axis can be used as important factors for surgeons in the T-stage diagnosis of EC, which helps to improve prognosis and treatment decisions after CTA.
We used Amira software to segment and 3D reconstruct the EC, oesophagus, aorta, pericardium and peripheral lymph nodes and measured their surface area, volume, major axis, minor axis, longitudinal length, roughness and relationship to the aorta of the EC. […] To obtain a 3D reconstructed model of the EC for further analytical studies, thin-CTA images of 1–2 mm thickness exported from the workstation in DICOM format were uploaded to Amira software (v.6.0.0) for manual segmentation of the EC images. […], Once image segmentation is complete, the original and segmented images were saved separately in “.am” format. 3D models were reconstructed using the Generate Surface in Amira software, which allows a 3D model of EC to be viewed in all directions, moved, scaled and rotated […], In the 3D EC reconstruction models, the surface area volume module in Amira software was used to measure the surface area and volume of the tumour and surrounding normal tissue and to analyse the volume relationships between tumour and total oesophageal at different T-stages. […]
For Research Use Only. Not for use in diagnostic procedures.